
When millions of conversations flow through your platform daily, reliability isn’t just a technical metric – it’s the foundation of customer trust.
At Intercom, where our AI Agent Fin resolves millions of customer inquiries autonomously, reliability starts with one essential question: Can our customers do the job they’re hired us to do?
This question has led us to develop what we call “heartbeat metrics” – vital signs that instantly tell us if our systems are truly serving their purpose. These metrics cut through the noise of complex monitoring dashboards and provide immediate clarity on customer impact. When a heartbeat metric drops, we don’t wait for customer complaints. We act immediately.
In this post, I’ll walk through what heartbeat metrics are, how we use them to define our Fin and Platform SLAs, and how you can create your own “heartbeat” to keep your engineering teams aligned and your customers happy – even as your systems grow increasingly complex.
What’s a heartbeat metric?
Modern systems are complex. Logs, dashboards, and tracing can help you debug issues once you know about them. Heartbeat metrics are about accelerating detection and understanding of customer impact. Think of it as a pulse check. If the pulse weakens, your customers can feel it instantly. A heartbeat metric is the clearest signal you can get that your product is alive and doing its job.
For Intercom, that job is conversations. So, our fundamental heartbeat metric is the rate of new messages and replies across Intercom. For Fin, it’s successful AI responses. If those dip, it’s hitting your ability to connect. It might be a database failover, a misconfigured fleet, or a bad code change – it doesn’t matter. What matters is that it’s hitting customers’ ability to use Intercom.
We’re not alone in having a concept like this. Amazon tracks order volume as their heartbeat. Affirm watches checkout attempts. If those numbers fall below expected levels, they don’t wait for a support ticket, they investigate immediately. Because they know their customers’ success depends on it.
Not just any metric can be your heartbeat. The best ones share these traits:
- Directly tied to customer value: It should represent the main job your product is hired to do.
- High-volume and predictable: Volume lets anomaly detection spot small drifts quickly.
- Binary in spirit: You want a metric where a drop is clearly a sign that things are broken, not just “a bit slower than usual.”
We’ve found that having a heartbeat metric:
- Detects issues faster than user reports or support tickets ever could.
- Keeps our focus on the things that truly matter to our customers.
- Ties directly to our SLA. It’s our system’s way of saying, “Yes, the promise we made to our customers is being kept.”
Of course, we still monitor all the usual suspects: latency, error rates, infrastructure health, etc. Heartbeat metrics don’t replace those – they complement them. They’re your shortcut to understanding customer impact, fast.
Multiple heartbeats: How we monitor
Engineering reliably at scale means recognizing that complex systems need multiple vital signs. While the concept is simple, the implementation requires careful consideration of what truly matters to customers.
At Intercom, we started simple: are customers creating messages at the expected rate?
That signal was so strong we broke it down further, tracking different heartbeat metrics across Intercom’s core systems.
Each of our heartbeat metrics gives us a different perspective on whether users of Intercom, both human and AI, can do what they need to do:
- Fin replies to your customers.
- Teammates reply in the Inbox.
- Teammates interact with the Inbox UI.
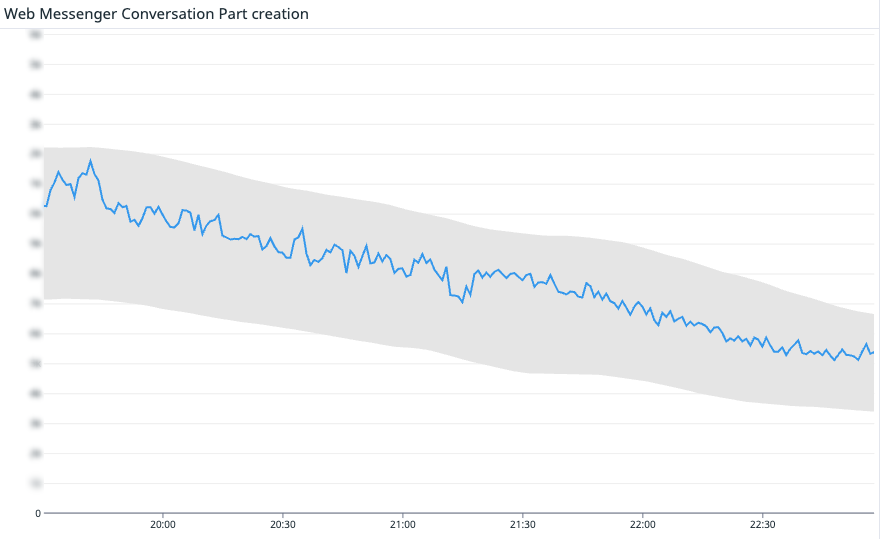
- Users on your website can message with the Web Messenger.
- Users on your app can message with the Mobile Messenger.
Together, these metrics form a more complete picture of Intercom’s overall health. If even one of them drops, it’s a major customer-impacting problem.
From detection to action
When the heartbeat alarm fires, speed is everything.
After months of reliable signal on its effectiveness, we connected it to automation to mitigate issues faster with engineers always double-checking. Here’s what happens when a heartbeat metric drops:
- If we have just deployed new code to production, we automatically roll it back. Rolling back recent changes is a safe, and fast operation.
- We automatically create an incident in incident.io and page in engineering and an incident commander. If this alarm fires, it’s likely we will need our full incident response including status page updates.
- The system automatically suggests initial actions to first responders. For example, we use incident.io’s Investigations feature to get a head start on suggesting root causes.
This automated response played out perfectly during a recent incident:
On April 24th, a server issue slowed the Inbox, impacting teammates’ ability to use the Inbox. Our heartbeat metrics caught it fast, and we resolved it in 10 minutes. You can see in the second graph that end-user messaging was unaffected. This incident counted as downtime toward our SLA, and we shared a full root cause analysis publicly here.
Heartbeat-driven SLAs
Our heartbeat metrics don’t just monitor – they also define our SLAs, keeping us accountable to our customers. We use these important metrics to measure two independent SLAs:
- Core Platform SLA: If your team can’t reply in the Inbox or customers can’t message via the Messenger, that’s downtime.
- Fin SLA: If Fin cannot generate text answers, we record downtime.
Downtime, in relation to the SLA, is triggered when there’s a systemic issue affecting the platform. For example, a delay impacting a small feature wouldn’t count against the SLA (but will obviously be investigated as an incident). But if a customer loses the ability to execute core functionality, or if Fin is broadly failing to respond, that’s when it counts as downtime toward our SLAs.
Measurement matters. Many status pages stay green as long as an HTTP probe returns 200 OK, even when users are stuck. Heartbeat metrics close that gap by checking real customer outcomes, not just server responses.
We don’t just look for absolute drops to zero. We use anomaly detection, tracking expected message patterns over time, and flagging when something looks off. When needed, we’ve additional tooling where we drop to a per customer level for investigating individual impact.
A playbook for building your own reliability heartbeat
If you don’t have a heartbeat metric yet, start simple. Here’s our playbook:
- Pinpoint your product’s must-do job: What’s one thing customers absolutely need to accomplish to be successful with your product?
- Choose a metric with volume: You want something predictable enough to spot anomalies quickly, not just total failures.
- Make it binary in spirit: If the metric drops, it should be because something is broken.
- Hook it to your alerts: Make it loud and ensure it reaches the right people.
- Use it to align your teams: When the heartbeat falters, everyone should know what it means and what to do next.
- Stick to it, 24/7: Reliability isn’t a 9-to-5 job.
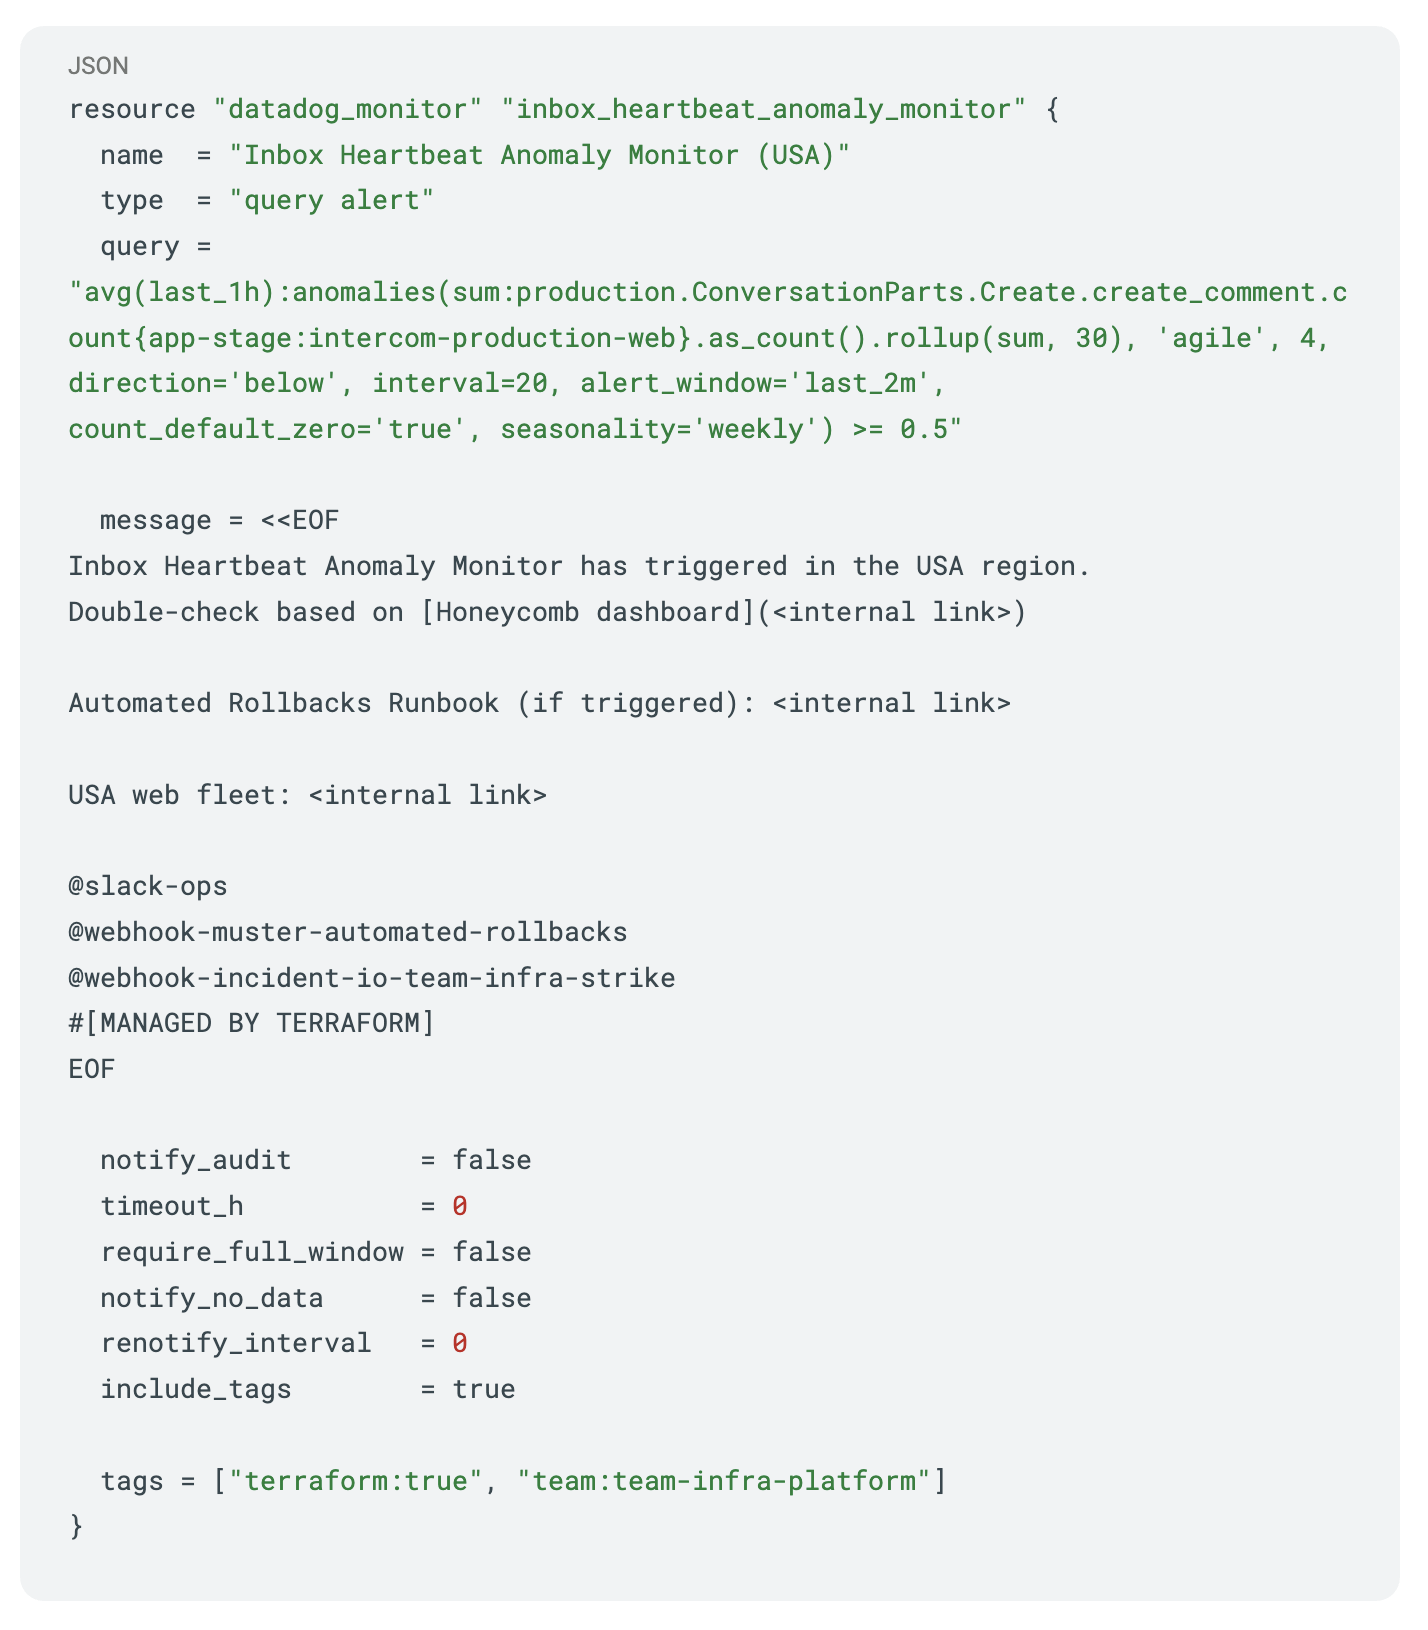
Here’s a Datadog monitor we use for the Inbox heartbeat (Terraform syntax, simplified for clarity):
The power of heartbeat metrics lies in their simplicity. While modern systems grow increasingly complex, the fundamental question remains refreshingly straightforward: “Can our customers do what they came here to do?”
At Intercom, our heartbeat metrics keep us honest, aligned, and fast. Define yours – it might become your most valuable signal.